
Ӳкерчĕк:Butterworth response.svg

SVG файлӑн PNG умкурӑмӗн калӑпӑшӗ: 512 × 384 пиксел. Ытти разрешенисем: 320 × 240 пиксел | 640 × 480 пиксел | 1024 × 768 пиксел | 1280 × 960 пиксел | 2560 × 1920 пиксел.
Оригиналлӑ файл (SVG файлӗ, йӗркеллӗ виҫе 512 × 384 пкс, файл калӑпӑшӗ: 41 Кб)
Кĕскен ăнлантарни
| Ӑнлантарни |
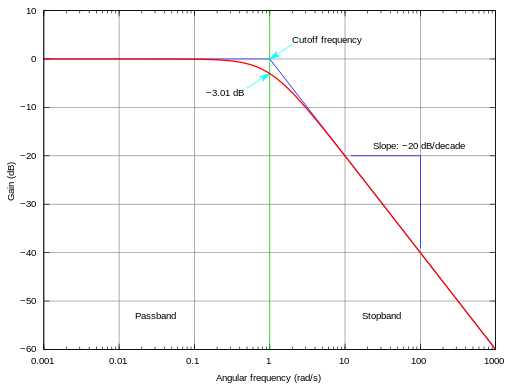
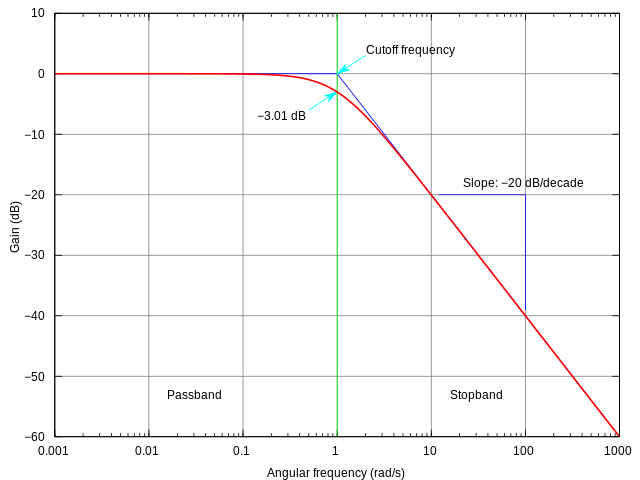
English: This is the SVG version of the PNG image created by Omegatron.
I simply changed the terminal type from PostScript to SVG in the gnuplot script file. The frequency response of a Butterworth filter with logarithmic axes (Bode plot) and various labels. Cutoff frequency is normalized to 1 rad/s. Gain is normalized to 0 dB in the passband.
Это plot было создано с помощью Gnuplot. |
||||
| Дата | (UTC) | ||||
| Ҫӑлкуҫ | |||||
| Автор |
|
||||
| Другие версии |
|
||||
| gnuplot source | click to expand
set samples 2001
# set terminal postscript enhanced landscape color lw 2 "Times-Roman" 20
set terminal svg size 800 600 dynamic enhanced
set output "butterworth.svg"

# Butterworth amplitude response and decibel calculation.  n is the order, which is just 1 in this image.
G(w,n) = 1 / (sqrt(1 + w**(2*n)))
dB(x) = 20 * log10(abs(x))

# Gridlines
set grid

# Set x axis to logarithmic scale
set logscale x 10

# Set range of x and y axes
set xrange [0.001:1000]
set yrange [-60:10]

# Create x-axis tic marks once per decade (every multiple of 10)
set xtics 10

# Use 10 x-axis minor divisions per major division
set mxtics 10

# Axis labels
set xlabel "Angular frequency (rad/s)"
set ylabel "Gain (dB)"

# No need for a key
set nokey #0.1,-25

# Frequency response's line plotting style
set style line 1 lt 1 lw 2

# Draw a separator between passband and stopband and label them
set style line 2 lt 2 lw 1
set style arrow 2 nohead ls 2
set arrow 3 from 1,-60 to 1,10 as 2

# Label coordinates are relative to the graph window, not to the function, centered at the 1/4 and 3/4 width points
set label 1 "Passband" at graph 0.25, graph 0.1 c
set label 2 "Stopband" at graph 0.75, graph 0.1 c

# Asymptote lines and slope lines are the same "arrow" style
set style line 3 lt 3 lw 1
set style arrow 3 nohead ls 3

# Draw asymptote lines
set arrow 1 from 1,0 to 1000,-60 as 3
set arrow 2 from .001,0 to 1,0 as 3

# -3 dB arrow style and arrow
set style line 4 lt 4 lw 1
set style arrow 4 head filled size screen 0.02,15,45 ls 4
set arrow 4 from 2,3 to 1,0 as 4

# "Cutoff frequency" label uses same coordinates as the function
set label 3 "Cutoff frequency" at 2,4 l

# "-3 dB" label
set arrow 5 from 0.5,-6 to 1,-3 as 4
set label 4 "-3.01 dB" at 0.5,-7 r

# Draw slope lines and label
set arrow 6 from 100,-20 to 12,-20 as 3
set arrow 7 from 100,-20 to 100,-39 as 3
set label 5 "Slope: -20 dB/decade" at 100,-18 c

# Plot the filter response
plot
     dB(G(x,1)) ls 1  title "1st-order response"

unset output      # cleanup the handle
|


Лицензилени
Я, владелец авторских прав на это произведение, добровольно публикую его на условиях следующих лицензий:
Этот файл доступен на условиях лицензий Creative Commons Attribution-Share Alike 3.0 Unported, 2.5 Generic, 2.0 Generic и 1.0 Generic.
- Эсир ирӗклӗн:
- ку ӗҫе ыттисене тивӗҫтерме – ку ӗҫе копилеме, сарма тата ыттисене пама
- унашкаллисене хатӗрлеме – ку ӗҫе улӑштарма
- Ҫак условисене пӑхӑнсан:
- атрибуци – Сирӗн кам автор пулнине кӑтартмалла, лицензи ҫине каҫӑ памалла та автор мӗнле те пулин улшӑнусем кӗртнипе кӗртменнине палӑртмалла. Ҫакна кирек мӗнле юрӑхлӑ меслетпе те тума пулать, анчах лицензиат сире пулӑшнине е сире асӑннӑ хайлавпа усӑ курма ирӗк панине кӑтартмасӑр.
- ҫав условисемпех сарма юрать – Енчен те эсир асӑннӑ хайлава тӗпе хурса ҫӗннине йӗркелетӗр, улӑштаратӑр, е урӑх хайлав тӑватӑр пулсан, сирӗн тӗпри хайлавӑн лицензипе е унпа пӗрешкеллипе усӑ курма тивет.

|
Ку документа Ирӗклӗ программа хатӗрӗсен фончӗ вырнаҫтарнӑ GNU Free Documentation License 1.2 версийӗпе е каяраххипе килӗшӳллӗн хуплашкан пӗрремӗш тата юлашки страницӑри улшӑнми пайсемсемпе текстсемсӗр копилеме, сарма тата/е улӑштарма юрать. Лицензи копине GNU Free Documentation License ятлӑ пая вырнаҫтарнӑ. |
Эсир ҫак лицензисенчен хӑть те хӑшне суйлама пултаратӑр.
Исходный журнал загрузок
This image is a derivative work of the following images:
- Image:Butterworth_response.png licensed with Cc-by-sa-3.0,2.5,2.0,1.0, GFDL
- 2005-07-23T17:45:55Z Omegatron 1240x880 (87607 Bytes) split the cutoff frequency markers
- 2005-07-23T16:31:54Z Omegatron 1250x880 (94570 Bytes) Better butterworth filter response curve
- 2005-06-26T19:54:33Z Omegatron 250x220 (2251 Bytes) A graph or diagram made by [[User:Omegatron]]. (Uploaded with Wikimedia Commons.) Source: Created by [[User:Omegatron]] {{GFDL}}{{cc-by-sa-2.0}} [[Category:Diagrams]]\
Uploaded with derivativeFX
Файл историйĕ
Вӑхӑт ҫине пуссан, ун чухнехи версине пӑхма пулать.
| Дата/Вăхăт | Миниатюра | Калӑпӑш | Хутшăнакан | Асăрхав | |
|---|---|---|---|---|---|
| хальхи | 09:50, 25 Ака уйӑхӗн 2013 | | 512 × 384 (41 Кб) | Incnis Mrsi | dehyphenation |
| 23:17, 4 Утӑ уйӑхӗн 2008 |  | 512 × 384 (41 Кб) | Krishnavedala | {{Information |Description=This is the en:SVG version of the en:PNG image created by en:User:Omegatron. I simply changed the terminal type from en:postscript to SVG in the en:GNUplot script file. The [[w:frequency response|frequency |
Файлпа усă курни
Ку файлпа ҫак 1 страницӑра усӑ курнӑ:
Файлпа глобаллӑ усӑ курасси
Ку файлпа ҫак викисенче усӑ курнӑ:
- ca.wikipedia.org усӑ курасси
- de.wikipedia.org усӑ курасси
- en.wikipedia.org усӑ курасси
- en.wikibooks.org усӑ курасси
- eo.wikipedia.org усӑ курасси
- es.wikipedia.org усӑ курасси
- et.wikipedia.org усӑ курасси
- fa.wikipedia.org усӑ курасси
- fi.wikipedia.org усӑ курасси
- ko.wikipedia.org усӑ курасси
- pt.wikipedia.org усӑ курасси
- simple.wikipedia.org усӑ курасси
- su.wikipedia.org усӑ курасси
- uk.wikipedia.org усӑ курасси
- vi.wikipedia.org усӑ курасси
- zh.wikipedia.org усӑ курасси