
Ӳкерчĕк:Components of the Cryosphere.tif
TIF файлӑн PNG умкурӑмӗн калӑпӑшӗ: 463 × 599 пиксел. Ытти разрешенисем: 185 × 240 пиксел | 371 × 480 пиксел | 593 × 768 пиксел | 791 × 1024 пиксел | 2048 × 2650 пиксел.
Оригиналлӑ файл ((2048 × 2650 пиксел, файл пысăкăше: 20,91 Мб, MIME-тĕсĕ: image/tiff))
Кĕскен ăнлантарни
| Ӑнлантарни |
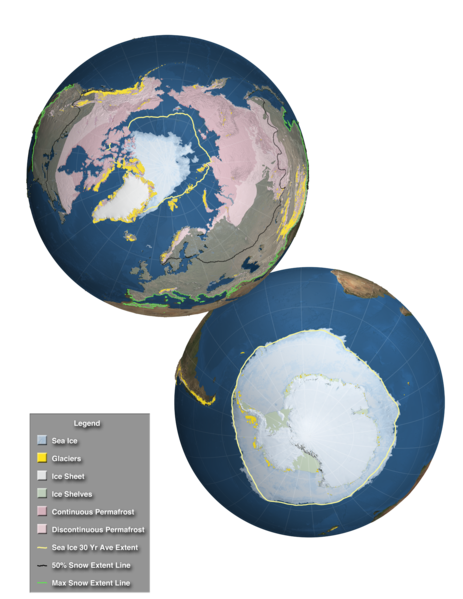
English: This high resolution image, designed for the Fifth Assessment Report of the Intergovernmental Panel on Climate Change, shows the extent of the regions affected by components of the cryosphere around the world. Over land, continuous permafrost is shown in a dark pink while discontinuous permafrost is shown in a lighter shade of pink. Over much of the northern hemisphere's land area, a semi-transparent white veil depicts the regions that are affected by snowfall at least one day during the perion 2000-2012. The bright green line along the southern border of this region shows the maximum snow extent while a black line across the North America, Europe and Asia shows the 50% snow extent line. Glaciers are shown as small golden dots in mountainous areas and in the far northern and southern latitudes. Over the water, ice shelves are shown around Antarctica along with sea ice surrounding the ice shelves. Sea ice is also shown at the North Pole. For both poles. the 30 year average sea ice extent is shown by a yellow outline. In addition, the ice sheets of Greenland and Antarctica are clearly visible. |
| Дата | |
| Ҫӑлкуҫ | Goddard Multimedia |
| Автор | NASA/Goddard Space Flight Center Scientific Visualization Studio |
Лицензилени
| Этот файл находится в общественном достоянии (англ. public domain), так как он был создан NASA (Национальным управлением по аэронавтике и исследованию космического пространства). Политика авторского права NASA гласит, что «Материал NASA не защищается авторским правом, если не указано иное». (См. Template:PD-USGov, страницу политики авторского права NASA или политику использования изображений JPL.) | ||
 |
Предупреждения:
|
Файл историйĕ
Вӑхӑт ҫине пуссан, ун чухнехи версине пӑхма пулать.
| Дата/Вăхăт | Миниатюра | Калӑпӑш | Хутшăнакан | Асăрхав | |
|---|---|---|---|---|---|
| хальхи | 14:22, 3 Раштав уйӑхӗн 2013 |  | 2048 × 2650 (20,91 Мб) | Originalwana | {{Information |Description ={{en|1=This high resolution image, designed for the Fifth Assessment Report of the Intergovernmental Panel on Climate Change, shows the extent of the regions affected by components of the cryosphere around the world. Over... |
Файлпа усă курни
Ку файлпа усӑ куракан страницӑсем ҫук.
Файлпа глобаллӑ усӑ курасси
Ку файлпа ҫак викисенче усӑ курнӑ:
- azb.wikipedia.org усӑ курасси
- de.wikipedia.org усӑ курасси
- es.wikipedia.org усӑ курасси
- eu.wikipedia.org усӑ курасси
- fr.wiktionary.org усӑ курасси
- he.wikipedia.org усӑ курасси
- hi.wikipedia.org усӑ курасси
- ja.wikipedia.org усӑ курасси
- ky.wikipedia.org усӑ курасси
- la.wikipedia.org усӑ курасси
- sr.wikipedia.org усӑ курасси
- sv.wikipedia.org усӑ курасси
- th.wikipedia.org усӑ курасси
- vi.wikipedia.org усӑ курасси
- www.wikidata.org усӑ курасси
- zh-yue.wikipedia.org усӑ курасси